
The full report is available in Swedish
Summary
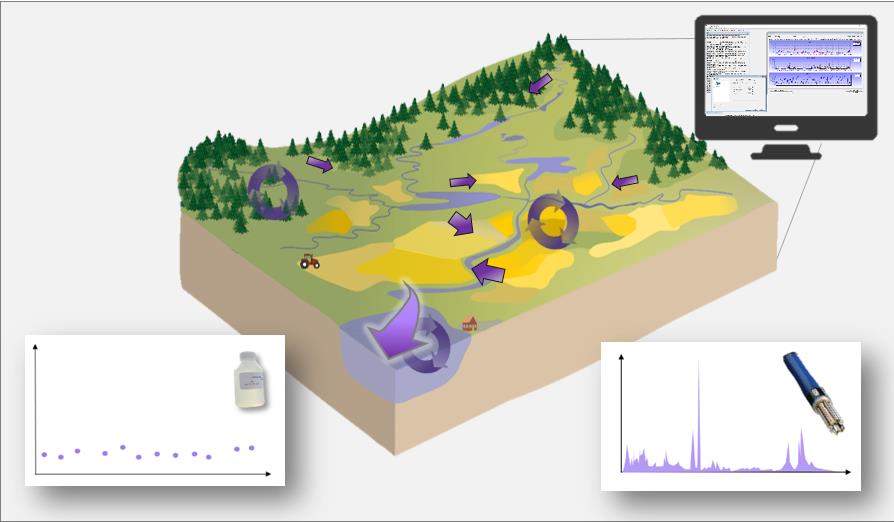
The use of in-situ sensors to generate high-frequency data sets (e.g. every 15th min) can give insights into biogeochemical and hydrological processes in specific streams. In this report, we are giving three examples of how these data sets can be upscaled and the conclusions generalised.
In the first example water level, which can be monitored with in-situ sensors (pressure transducers), was used to predict discharge with the rainfall-runoff model PER-SiST. An “artificial rating curve” was created without costly installations or time consuming field work. The set-up was tested with high-frequency data (hourly) with available precipitation and temperature data, and on a daily time step. The result depends a lot on the input precipitation and temperature data series, but looks promising. The quality of data and applicability in different streams need to be further investigated before this method could be used by water managers.
In the second example sensor and discharge data was analysed together (C-Q analy-sis) to improve understanding about processes affecting the stream, e.g. particle mobilisation. Analysis of turbidity dynamics during high flow events showed that the four studied streams reacted differently to the higher discharge. When additional environmental conditions are added (snow melt, rain/snow, soil moisture) the response in the streams can be attributed to specific processes and/or seasons. This information can guide mitigation measures in streams, and identify streams that are especially vulnerable to impacts of climate change (intense rainfall, fast changes in discharge).
Furthermore, high-frequency sensor data was used for calibration in a catchment scale water quality model (INCA-PEco). The large variation in sensor data made it harder to calibrate the model and make observed and modelled concentrations fit. Using high-frequency sensor data (daily) in the model resulted in both higher concentrations (mg/l) and loads (kg/day) compared to low-frequency data (monthly). More experience is needed to evaluate the applicability of sensor data in modelling within water management.
A few examples have been given on how we can increase the usability, and by that also the value of sensor data. If sensor data can be used by water managers, be upscaled and generalised it will be easier to motivate why we need it. This work is still in an early stage, and more experience is needed to understand how to apply it in Swedish water management.