
This is an appendix to: Huser et al. 2023. Handbook – a decision-support tool for measures against internal phosphorus loading in lakes.
Download pdf-version of appendix 4
Purpose
This document describes how environmental monitoring data can be used to calculate the magnitude of internal loading. The calculated internal load can then be used to indicate whether internal loading in the lake is elevated compared to that in unaffected lakes. It is also possible to compare the calculated internal load with the external load to get an idea of their relative contribution to the total load.
Appendix 3 describes the environmental monitoring data needed for the calculations and how to obtain them.
Principles
Internal loading, in this case, is calculated from a lake mass balance for phosphorus, where a positive balance corresponds to internal loading. This is known as the net internal load (Pni) because it is the difference between the phosphorus released from the sediments (gross internal load, Pgi) and the phosphorus in the water that is used by biota in the lake and then sediments on the lake bottom. It is the gross amount of phosphorus released from the sediment that directly increases the amount of phosphorus in the lake water and thus contributes to lake eutrophication. Whenever possible, it is therefore recommended to calculate the gross internal loading rate from the net rate and an estimate of the sedimentation rate. The gross internal load is what should be compared with the external load in order to assess which measures would be most effective.
Mixed lakes and polymictic lakes during periods without stratification
The net internal load (Pni) is calculated using a simplified mass balance calculation for phosphorus:
Pni = ΔPlake – Pin + Pout (net mass balance),
where ΔPlake is the change in the amount of phosphorus in the lake between sampling times and Pin and Pout are the inflow and outflow of phosphorus from the lake.
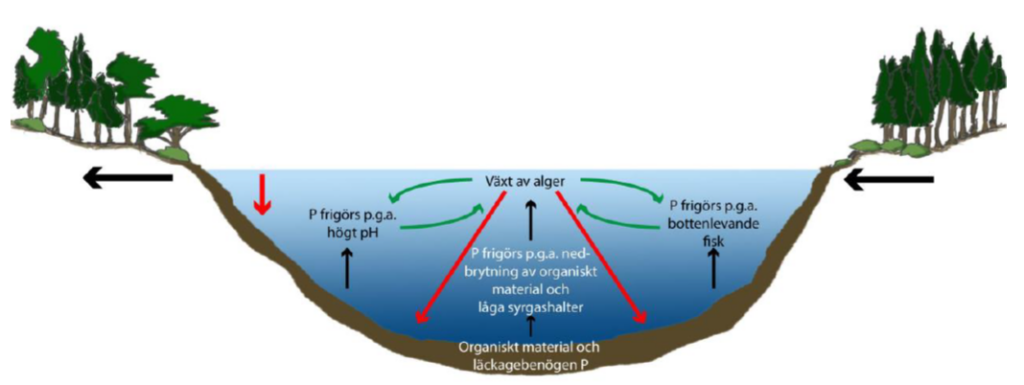
Algae grow during the summer and in the process consume nutrients. When the algae die, they either settle or are eaten by zooplankton, which in turn die and settle or are eaten by fish. Phosphorus in fish and zooplankton faeces also settles. Therefore, net internal loading is actually the sum of two opposite processes, as in an elevator: release of phosphorus from the sediments with transfer of phosphorus to the aqueous phase – the elevator goes up, and sedimentation of phosphorus from the aqueous phase to the sediments – the elevator goes down (Figure 1).
The simplified net mass balance calculation does not measure these processes separately. Internal load therefore refers to the net internal load (Pni):
Pni = gross internal load (Pgi) – sedimentation (Psed)
A high gross internal load may therefore be rendered invisible if there is high sedimentation in parallel so that the resulting net internal load becomes low. Calculating only the net internal load can therefore lead to a significant underestimation of internal loading.
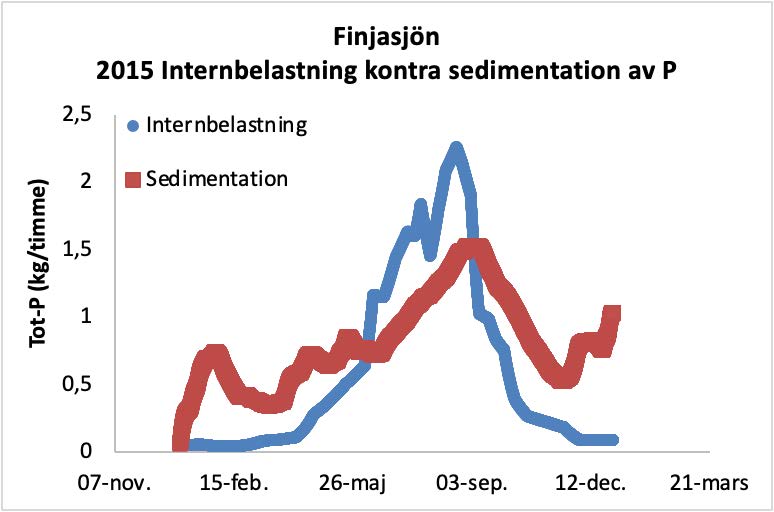
An example is Lake Finjasjön in Hässleholm (Figure 2). The calculated net internal load for 2015 was negative and amounted to -0.4 tonnes of P, i.e., there was net sedimentation of phosphorus. In contrast, the gross internal load was calculated at 5.3 tonnes using a dynamic model (Step 3 of the tool) that separates internal load and sedimentation (Table 1).
| Sources | Dynamic lake model (tonnes of P) |
| Inflow, Pin | 4.17 |
| Gross internal load, Pgi | 5.32 |
| Total | 9.49 |
| Sinks | |
| Sedimentation | 7.10 |
| Outflow, Pout | 3.50 |
| Total | 10.60 |
| ΔPlake | 1.1 |
Calculating only the net internal load would therefore lead to the conclusion that there is no or very little risk of elevated internal load, despite the fact that there is a significant gross internal load during the summer months leading to algal blooms. The algae in turn contribute to a high sedimentation when they die and settle (see Figure 1). Using the modified equation below is therefore recommended wherever possible to calculate internal phosphorus loading for mixed and poorly stratified lakes:
Pgi = ΔPlake – Pin + Pout + Psed (gross mass balance),
where Psed is the amount of phosphorus settling from the lake water.
How to carry out the calculation is described below in the section entitled “Consideration of sedimentation and calculation of gross internal load”.
Dimictic lakes
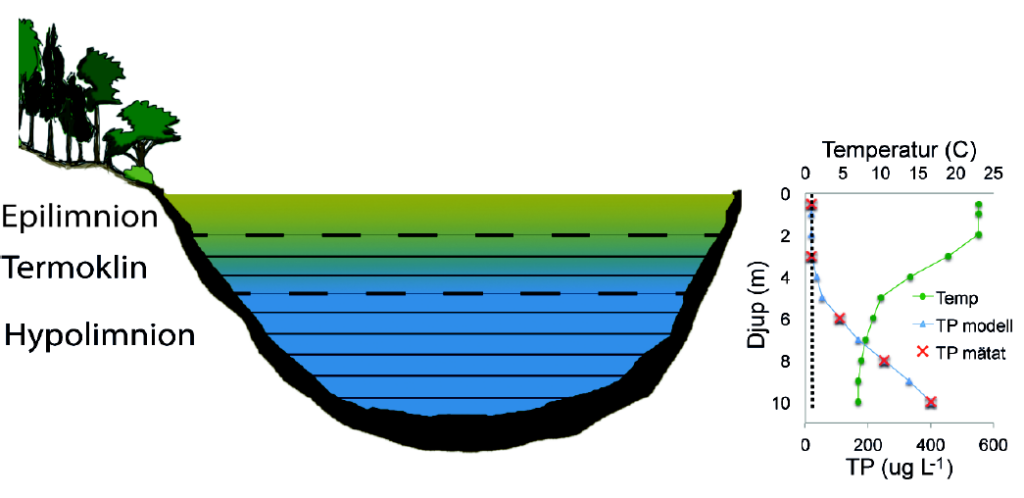
In dimictic lakes with stable stratification phosphorus released from the sediments accumulates in the water mass below the thermocline. The movement of phosphorus from the bottom water near the lake bottom to the surface water is limited by the low diffusion rate of phosphorus in water. During periods of stable stratification, internal loading in these lakes therefore appears as a typical phosphorus profile with high phosphorus concentrations in the water near the bottom with gradually lower concentrations towards the surface water (Figure 3). Internal loading is quantified as the increase in the amount of phosphorus in the water below the thermocline during periods of stable stratification.
Calculation of internal loading
Mixed lakes and polymictic lakes with unstable stratification
This method is used for fully mixed lakes and polymictic lakes during periods when they show no stable stratification.
Data requirements
The following is needed to be able to perform the calculation:
- a bathymetric map with a resolution of at least 1 m and a hypsograph constructed from the bathymetric map
- at least monthly data on phosphorus inflows and outflows, which requires measurement of both volumetric waterflows and phosphorus concentrations
- at least monthly data on TP in the lake and the lake level when taking samples from lakes with variable water levels.
Calculation of net internal load in kg of P
The net internal load, Pni, is calculated from the net mass balance:
Pni = ΔPlake – Pin + Pout (in kg P)
The phosphorus inflow and outflow are calculated by multiplying the measured phosphorus concentration with the volumetric waterflow for each tributary. To calculate the amount of phosphorus between two samples, it is necessary to take an average of the phosphorus concentrations and waterflow during the first and second sampling periods.
If the water mass of the lake was fully mixed when the samples were taken, the amount of phosphorus in the lake is calculated by multiplying the measured concentration by the total water volume of the lake. If water level measurements are available when the samples are taken, these can be used to calculate the water volume at different water levels using the lake’s hypsograph. However, this requires that the water level (or maximum depth) was known when the bathymetric mapping, on which the hypsograph is based, was carried out.
If the lake was partially stratified during sampling and the data show that the phosphorus concentration is not constant with depth, the amount of phosphorus in the lake is calculated by totalling the amount of phosphorus for each depth layer in the lake. How this is done is described in the section on dimictic lakes below. Note, however, that for polymictic lakes the amount of phosphorus in the surface water layer is also included in the calculation, and not just the amount below the thermocline. Thus, the amount of phosphorus in the whole water body is calculated. If this method is used, it must be applied throughout the season in order to compare amounts of phosphorus and calculate internal loading between sampling periods.
Consideration of sedimentation and calculation of gross internal load
In polymictic and mixed lakes, periods of net sedimentation are not uncommon, i.e. where sedimentation is higher than internal loading. If sampling has captured periods of net sedimentation, data for these periods can be used to estimate net sedimentation rates. It is important to be aware that these data are an underestimate of the true (gross) sedimentation rate as there simultaneously may still have been internal loading taking place. Periods of net sedimentation often occur in spring and late autumn when internal loading is at its lowest and these periods may be used to estimate net sedimentation.
To estimate sedimentation, the standard mass balance equation is used to calculate internal loading:
Pni = ΔPlake – Pin + Pout (net mass balance)
When PNI becomes negative, there is more sedimentation than internal load and PNI can be equated to the sedimentation rate, Psed, if it can be assumed that internal loading is negligible. As there are usually different numbers of days between sampling operations, the amount of phosphorus (kg) has to be transformed into the amount of phosphorus per unit time (kg/day). This is easily done by dividing the amount of sedimentation by the number of days between sampling events. These amounts are added to the net internal load.
Table 2 shows an example from a fully mixed lake where samples were taken between 28 April and 19 October. The net internal load was calculated using the formula for a net mass balance. Sedimentation was greater than the (gross) internal load during the periods when the net internal load was negative. In this example, the calculated net internal load was most negative in late autumn between 7 and 19 October (283 kg). It is reasonable to assume that the (gross) internal load was negligible during this late autumn period, and the calculated negative net internal load can therefore be equated to sedimentation. The sedimentation rate during this period was 23 kg of P/day (283/12 days). It is possible to calculate the sedimentation in kg of P between each sampling operation by also assuming that the sedimentation rate remains constant throughout the sampling period. This is done by multiplying the sedimentation rate (23 kg of P/day) by the number of days between sampling operations. These amounts are added to the calculated net internal load in order to calculate the gross internal load, Pgi:
Pgi = Pni + Psed
The results are shown in Table 2.
| Date | Net internal load, Pni (kg) | Sedimentation, Psed (kg) | Gross internal load, Pgi (kg) |
| 28/04/2020 | |||
| 14/05/2020 | -67 | 378 | 311 |
| 28/05/2020 | 58 | 330 | 388 |
| 08/06/2020 | 35 | 260 | 294 |
| 26/06/2020 | -16 | 425 | 408 |
| 10/07/2020 | 95 | 330 | 425 |
| 29/07/2020 | -143 | 448 | 305 |
| 04/08/2020 | 255 | 142 | 397 |
| 18/08/2020 | 212 | 330 | 542 |
| 02/09/2020 | -3 | 354 | 351 |
| 15/09/2020 | 10 | 307 | 317 |
| 07/10/2020 | 12 | 519 | 531 |
| 19/10/2020 | -283 | 284 | 0 |
It is also possible to use periods during the summer to estimate sedimentation. This is done if there are no periods in early spring or late autumn when the amount of phosphorus in the lake water decreases. However, it is important to be aware that measuring sedimentation in the summer will almost certainly underestimate, leading to an underestimate of internal loading. Gross internal loading cannot be calculated if there are no instances of negative internal load (net sedimentation).[1]
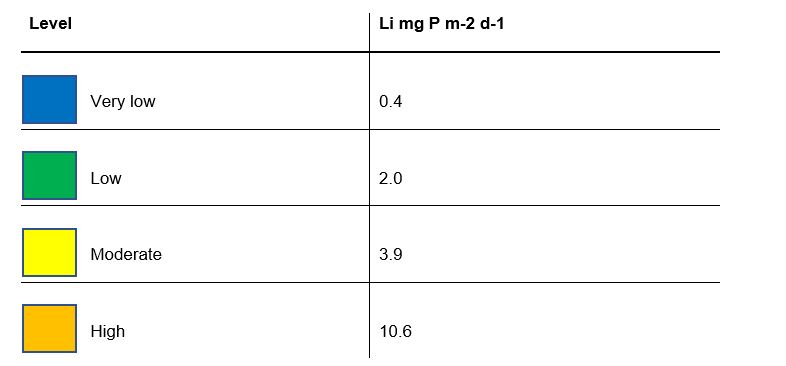
Calculation of the internal loading rate, Li
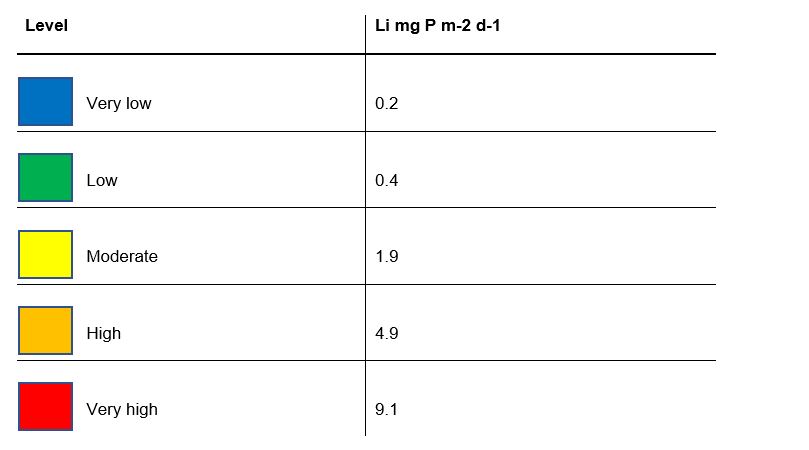
The internal loading rate for mixed and polymictic lakes expressed per bottom area is calculated by dividing the internal loading rate in kg of P by the number of days between sampling events and the total bottom area of the lake. The calculated rate, Li, is expressed in mg of P m-2 d-1 and can be compared with the values in Table 3 below.
Dimictic lakes
This method is used for dimictic lakes with stable stratification. It can also be used as a complementary calculation method for polymictic lakes during periods when they are stratified. In that case the amount of phosphorus in the lake is, however, calculated for the entire lake volume, and not just for the lake depths below the thermocline.
Data requirements
The following is needed to perform the calculation:
- a bathymetric map with a resolution of at least 1–3 m, depending on the depth of the lake
- at least monthly data on TP throughout the profile (see Appendix 3 for how sampling should be carried out)
- temperature profile data at least every metre (to determine the thermocline).
Calculation of internal load in kg of P
The amount of phosphorus in the lake (kg of P) below the start of the thermocline is calculated by multiplying the phosphorus concentrations for each depth layer below the thermocline by the water volume of that layer. The magnitude of the temperature change for each metre of depth is used to assess the depth at which “bottom water” (where the thermocline) begins. The thermocline begins at the point where the change is 1 °C per meter or more. The water volume from that level and deeper is used to calculate the amount of phosphorus below the thermocline (see the example in Table 4).
| Water depth (m) | Temperature (C) |
| 0.5 | 20.0 |
| 1 | 20.0 |
| 2 | 19.5 |
| 3 | 19.0 |
| 4 | 18.0 |
| 5 | 16.5 |
| 6 | 15.0 |
| 7 | 14.0 |
| 8 | 13.5 |
| 9 | 12.7 |
| 10 | 12.5 |
In highly stratified lakes the phosphorus concentration in the lake’s surface water above the thermocline is mainly influenced by the phosphorus concentration of the inflowing water. Algae use this phosphorus, die, and then settle through the water column on their way to the sediment. This happens continuously and increases the amount of phosphorus below the thermocline. The phosphorus level in the surface water is therefore subtracted from all samples before doing the calculations so as not to include this phosphorus.[2]
It is best to calculate the amount of phosphorus at 1 m depth intervals.[3] Appendix 5 describes how to calculate the water volume for every metre. As water chemistry sampling is usually carried out at depth intervals greater than 1 m, it is necessary to estimate the phosphorus concentration for every metre depth by interpolating between sampling depths. This can be done by fitting a line between the measured values for each sampling depth (Figure 3). The deepest sample is usually taken at least 1 m above the bottom, so it may be necessary to estimate the phosphorus concentration in water deeper than the maximum sampling depth. This is done by continuing with the same interpolation line linking the deepest sample to the second deepest. As an alternative to drawing straight lines between sampling depths, it is possible to apply an empirical curve describing how phosphorus concentrations change with depth and use the equation describing the curve to calculate phosphorus concentration for each metre interval.
The mass of phosphorus in the hypolimnion (in kg of P) is calculated by adding together the amount of phosphorus for every depth layer below the start of the thermocline. The internal load is calculated as the difference in the amount of phosphorus between two different sampling periods. The maximum internal load is calculated as the difference between the maximum amount of phosphorus below the thermocline (usually in late summer) and the amount of phosphorus below the thermocline shortly after spring mixing.
In stratified lakes, the phosphorus released from the sediments remains in the lake water without sedimentation as long as there is no significant phytoplankton growth below the thermocline. The internal load calculated as described above can therefore be regarded as the gross internal load.
It is important to apply the above method of calculation only during periods of stable stratification in the lake, otherwise there is a high risk of underestimating the internal load. Underestimation occurs if phosphorus released from the sediment reaches the surface water when stratification is weak, thereby increasing phosphorus concentrations in the surface water and decreasing them in the bottom water. This is often reflected in a seasonal shift in the depth of the thermocline, with phosphorus concentrations just above the thermocline higher than in the surface water. See Appendix 2 to assess whether or not the lake is highly stratified.[4] If the lake is deemed not to be highly stratified, the method for polymictic lakes must be used to calculate the internal load.
Calculate the internal loading rate, Li
To calculate the internal loading rate in terms of the bottom area contributing to the internal load, the magnitude of the internal load in kg of P is divided by the number of days between sampling events and the bottom area of the part of the lake that has a depth greater than the thermocline. The calculated rate, Li, is expressed in mg of P m-2 d-1 and can be compared with the values in Table 5 below.
Footnotes
[1] In Denmark, a model is used to estimate sedimentation on the basis of lake characteristics such as lake depth (Jensen et al. 2006). This model is calibrated for shallow lakes in Denmark, but may also be applicable to shallow lakes in southern Sweden.
[2] The internal load cannot be calculated if this results in negative phosphorus concentrations in the bottom water. However, this does not mean that there is no internal load. External loading may have increased the phosphorus levels in the surface water so that they are higher than those in the bottom water. Moreover, the lake may not have a stable stratification so that some of the phosphorus released from the sediment may have reached the surface water. In such cases, it is necessary to ensure that the lake has a stable stratification.
[3] Instead of calculating the amount of phosphorus at 1 m depth ranges, a simpler alternative is to calculate the amount for each depth interval between the bathymetric map’s isolines, or for each depth interval used for water chemistry sampling. However, this is a a more approximate calculation method that is justified only if the available data are considered too uncertain to justify interpolation to 1 m depth ranges. It is always important to ensure that the phosphorus concentration used in the calculation for each interval is representative for the entire interval, as phosphorus concentrations often change rapidly with depth.
[4] The lake can still be regarded as having a stable, strong stratification even if the depth of the thermocline changes slightly during the summer (1–2 m), provided that the bottom water temperature remains below 10 °C and that the temperature change at the thermocline remains at > 1 °C per metre.